Mauritius Buses
Online route enquiry
How was this website created?
First of all: This is not the official bus time table of Mauritius! It can be found on the website of the Mauritius Transport Authority.
Warning! The following part gets quite technical at some points. If you are usually bored by technical details, you might hate it.
The work on this project was divided into two parts. The first one was to get all the bus schedules into a database and the second one was to be able to calculate the best route based on this data.
Parsing the original PDFs
This part was really challenging because apparently nobody ever intended this data to be read by a computer. If you take a first look at some of the source pages, you might think "ah, not so bad", because the creators were using a common template to describe the lines and the stops. It is built of tables and those are usually quite easy to traverse programmatically. But the problem was that:
- The tables were not filled in an entirely consistent pattern (I am pretty sure they were filled out by different people). Look at the "Average journey time in minutes" column for example: Sometimes it is filled in, sometimes it is not. Sometimes the cumulated time is written, sometimes only the time from one stop to another. Sometimes numbers go up, sometimes numbers go down. And sometimes things barely make any sense at all.
- The names of the stops were not consistent, though this is essential for the routing to work. The computer has to know if two bus lines are serving the same stop in order to connect these two lines to a route. Again, in Berlin, were I come from, every bus stop has a unique name. Somebody once determined how a particular stop is called and spelled, then the name was printed on a sign. No official document would ever reference that bus stop with a different name. In Mauritius this is not the case: The names of the bus stops seem to be up to the people who write the schedules. Different people use different names and (mis-)spellings.
As if all that was not challenging enough, I wanted to make the parse process repeatable. The benefit is that if a new bus schedule comes out, I can pretty much just use the existing parser again. But it also meant that I had to do as little changes as possible to the original files before they were parsed.
How I detected bus stops that have different spellings, but are the same
Well, first of all, I tried to normalize the names. For that, I made all letters lowercase, removed all spaces, all accents (é → e) and all other stuff like dashes and parentheses. Additionally, I did some replacements like Jn → Junction, Rd → Road, R. Hill → Rose Hill and so on. Here is an example: Jn Nicoliere Rd/Eau Bouillie → junctionnicoliereroadeaubouillie
After the normalization, I calculated the so called Levenshtein Distance between each of the normalized strings. That is the number of letters you have to switch/add/delete to get from one name to another. If the distance was below a threshold, I could manually choose to use one of the spellings (an automated Google search on both spellings oftentimes made the right spelling apparent) or put the spellings on a blacklist so that I would not be asked again on the next run. Of course the process took a long time and involved also a lot of manual rules being hard coded.
How I detected bus stops that have the same spelling, but are different
Sadly, this was only half of the story. After I had merged all these different names, I became suspect that I might have made some wrong decisions along the way or even worse, there might be stops that were referenced by the exact same name, but are indeed at different places on the island. Let me give you an example: there is a village called "Riviere du Rempart" in the North-East of the island. Also, there is an actual stream called "Riviere du Rempart" in the South-West of the island near Tamarin. But if you look at the official schedule of Bus 119, you see that it is not possible to determine this from the name of the stop itself. Of course, every Mauritian who reads that schedule knows what is meant, but neither me nor my computer are from Mauritius ;-)
I addressed this issue by trying to find the location of every one of the ~ 900 bus stops by their names and than comparing the time estimate with the calculated distance between two bus stops.
I used the Google Geocoding API and other sources to do this.
Of course there was plenty of wrong location data, but with combining different data sources and a lot of manual work I was able to map over 70 % of the bus stops.
With that map I could start to find "supernatural" buses like ones that were traveling with over 700 km/h bee-line.
Through this, I found that for example there are six places called "Belle Vue" or similar on Mauritius, together with 3x "Beau Bois", 2x "Plaisance", and much more!
I had to find a way to programmatically distinguish these bus stops but sometimes I just gave up and edited the input files to have a unique name for each instance.
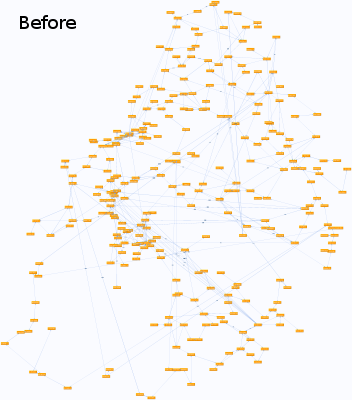
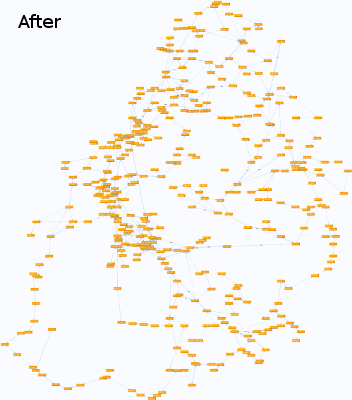
The following shows an example of before and after the cleanup (click to enlarge):


I will stop the description of the parsing process now, but there was a lot more to do like:
- Grouping bus stops in villages
- Determining the best spelling alternative for a bus stop
- Detecting and correcting mistakes in journey times. Interpolating missing values.
- Parsing the operation times and frequencies.
- Droping hazardous data points, e.g. two bus stops with the same name in one single bus line
Rest assured I had quite a few "WTF? moments" throughout the process!
Calculating a route
Now to the fun part: using the data I acquired in the sweat of my brow. As most of the computer scientists already suspect, this is a Graph Search Problem. To keep this article somewhat readable, I will not explain what that is in detail. Basically, it means that for every stop that a bus has, I created a "node" in a graph. These nodes are interconnected with "directed edges". Obviously, every bus connects "his" stops with each other (in one direction). Additionally, every possibility to change buses at one particular stop results in all the nodes there being interconnected. Later, it turned out to be very beneficial for the quality of results to also have walkable edges, so I had to generate them from location data and village groupings. Here the raw numbers: I got ~220 bus lines (most of them bidirectional), ~900 stops, resulting in ~6000 nodes and ~270.000 edges (~85.000 of them "walk edges").
Assigning costs
Obviously, all bus lines are not created equal. For example, you would prefer to use the express bus from Grand Baie to Port Louis if you can because it is twice as fast as the normal one. Another example would be that the system should prefer a bus that is leaving every 10 minutes over a bus that is only leaving a few times per day. I tried to break all the cost aspects down to some kind of time representation: For the bus edges this was relatively easy as I often knew the journey time for each stop. If I didn't have any time data at all, I just assumed the average time per stop which is 4.22 minutes.
For the change edges, there are two things to keep in mind: First, it is virtually always better to keep sitting in a bus than getting off the bus and using another one just for one stop. What sounds trivial to a human can create crazy results if you do not incorporate that into your cost function. Secondly, I assume that I will always have to wait half the average operating frequency for the next bus (For example, I have to wait 7.5 minutes for a bus that leaves every 10 minutes in the rush hour and every 20 minutes during the rest of the day). Of course, I had to find some way to also measure buses for which I do not know the frequency.
For the "walk edges", the contraints are similar: It has to be always less attractive to walk to a different bus stop than to just stay somewhere and wait for the next bus (given that everything else stays the same). And you guessed it, the walking distance also has be mixed into the cost function somehow...
Doing the actual computation
After preparing that huge "graph", the computer has to generate a good route between two given sets of nodes. I will spare you the details of:
- Ignoring different bus lines based on what day it is
- Ignoring different bus lines based on user preference (especially useful for getting alternative routes!)
- That the cost for walking has to be lowered in the village where you are starting / ending your journey
To do the actual computation I used an implementation of Dijkstra's algorithm, namely the Boost Graph Library. Before I went to use C++ for the computation, I tried to do this directly in PHP (in which the rest of this site is written), but I experienced very bad performance (> 5 minutes with PHP compared to 400 – 800 milliseconds with C++ for one single request!).
That's it for now. You can test drive the result here. If you have any questions, you can use the contact form.